A globe you could ask questions
UNICEF's SMS polls from across Africa became a spinning 3D globe at Google Zeitgeist, designed and built in under a week.
The brief
Google Zeitgeist is Google’s invite-only gathering of around 300 business leaders, world leaders and tech pioneers. UNICEF was attending, and Brand Fuel, who produced the event for Google, wanted a cool way to visualise some of UNICEF’s data for that audience.
The brief arrived one week before the event.
The idea
UNICEF’s U-Report is an SMS polling service that gives young people across Africa a voice: real-time questions, yes or no answers, published openly. On a screen it is a spreadsheet. We made it something you could pick up and spin.
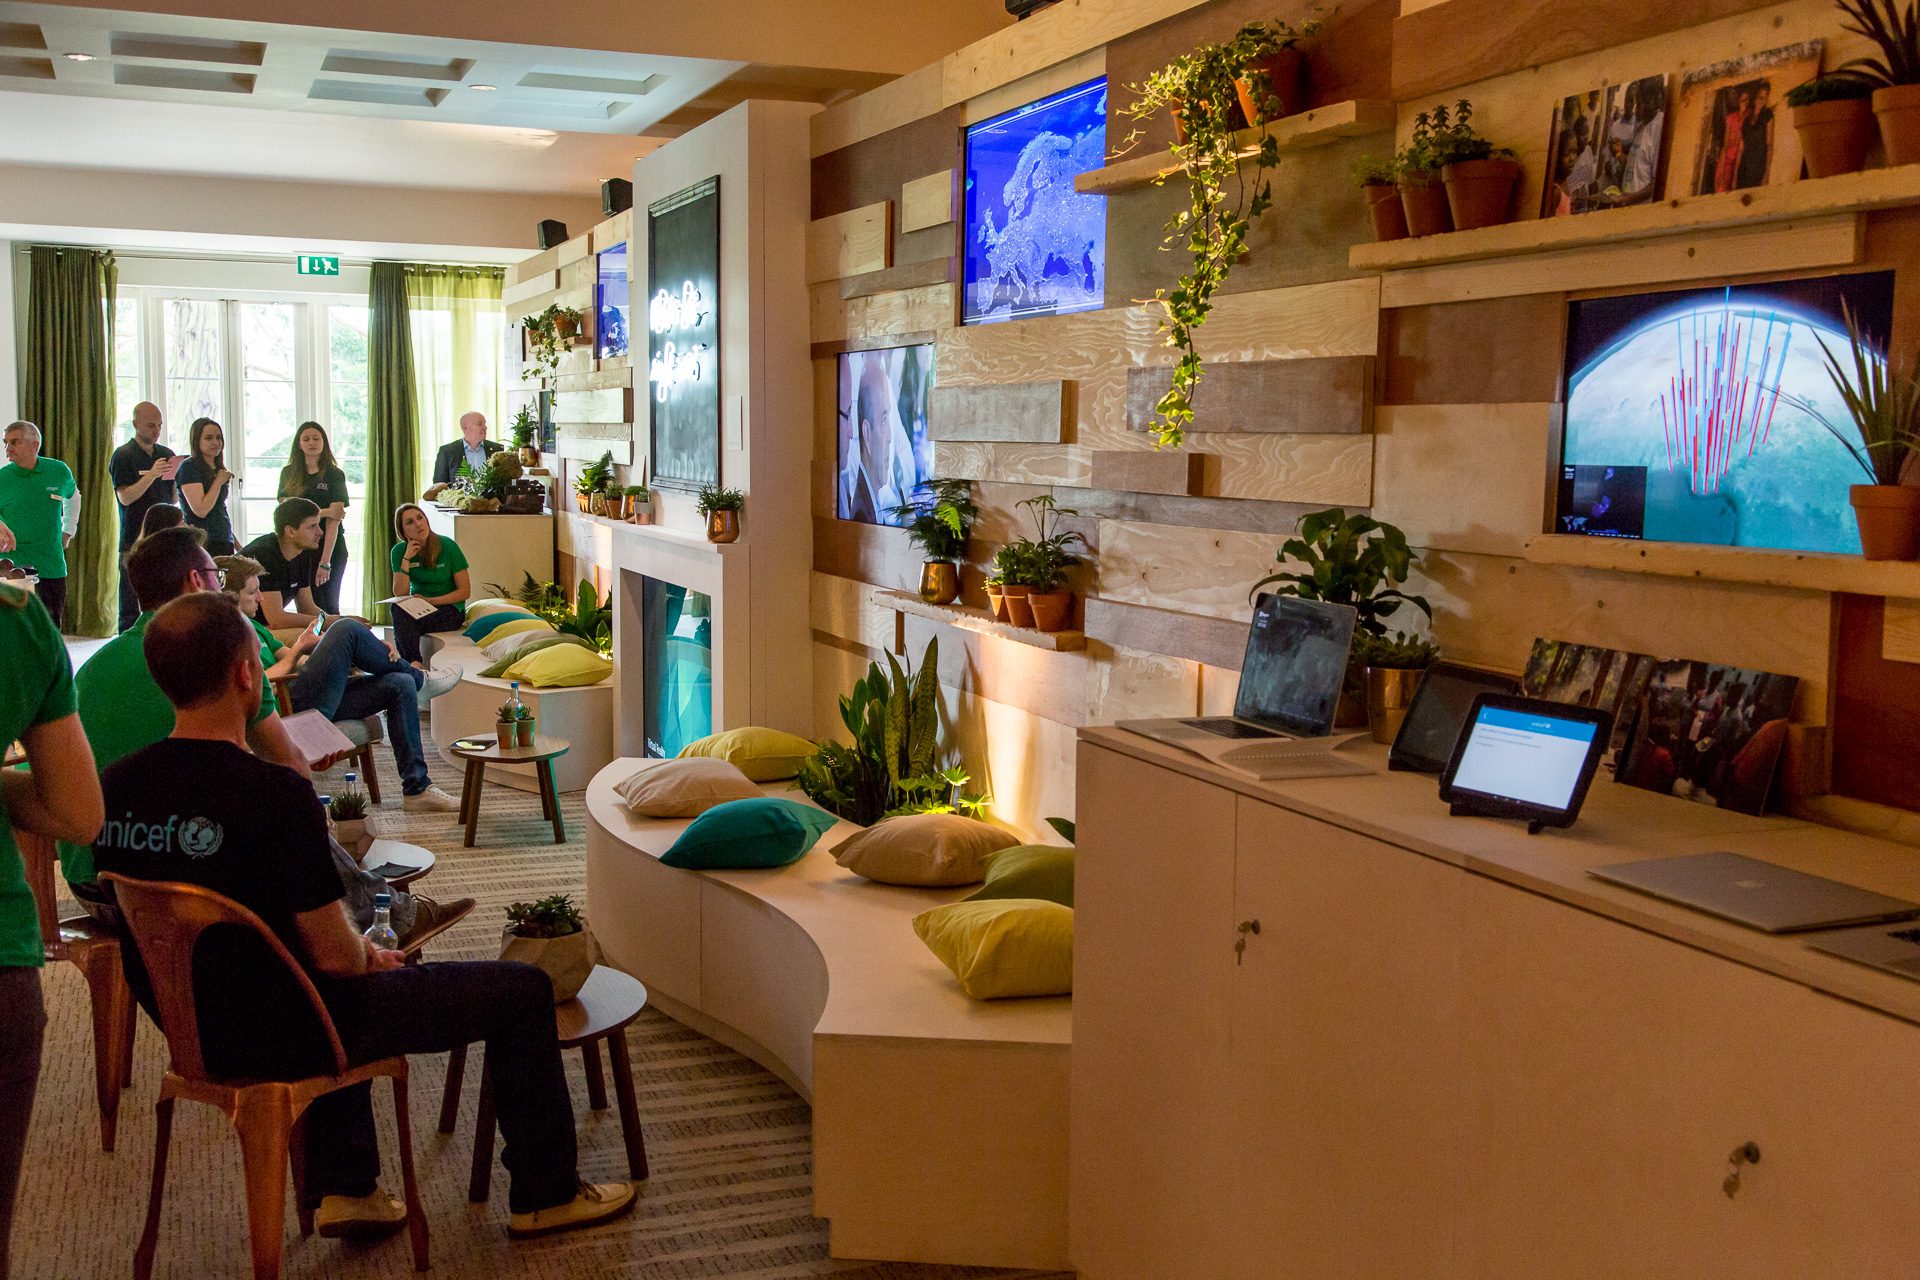
A touchscreen tablet on the counter lists the poll questions. Choose one, and on the big screen a 3D globe turns to Africa and grows bar charts out of the affected regions, each one showing the split of answers. Questions like “Have you been affected by the recent Boko Haram crisis?” stop being abstract when you can see where the answers came from.
What guests did
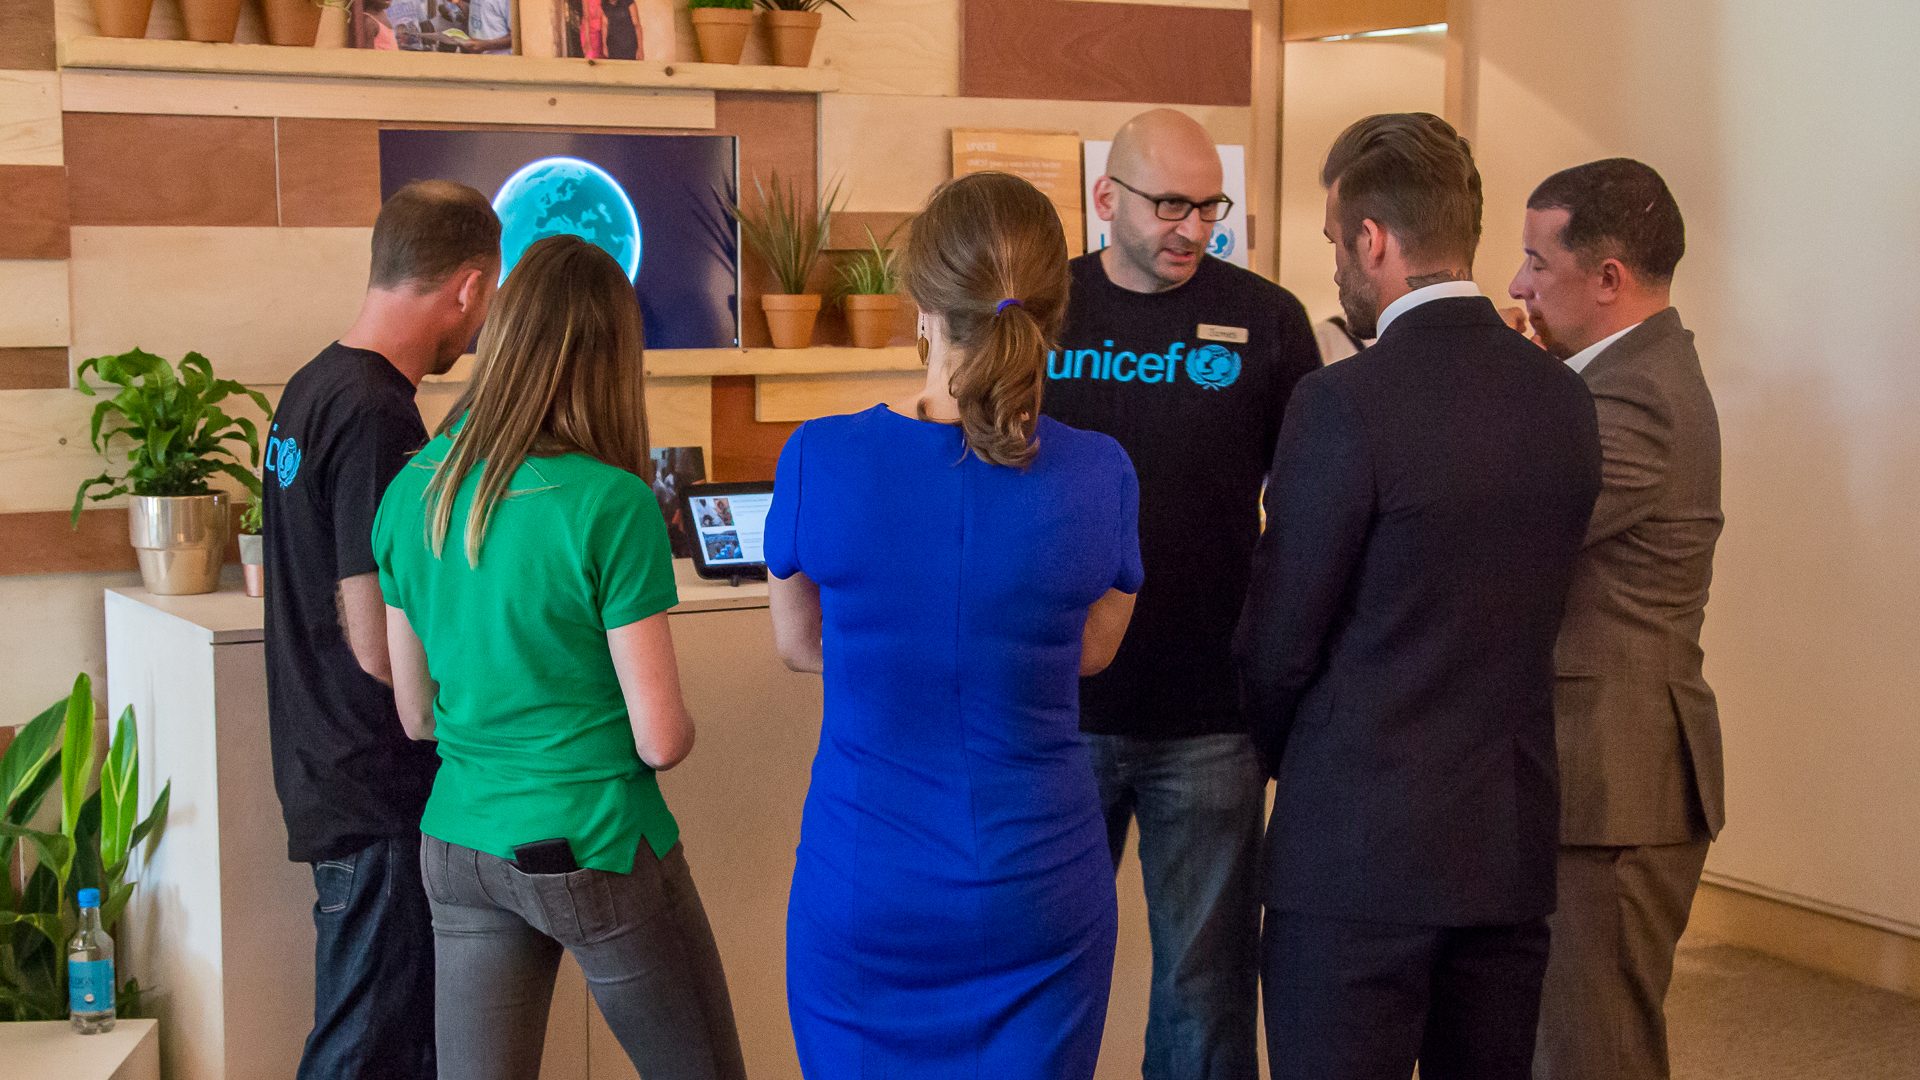
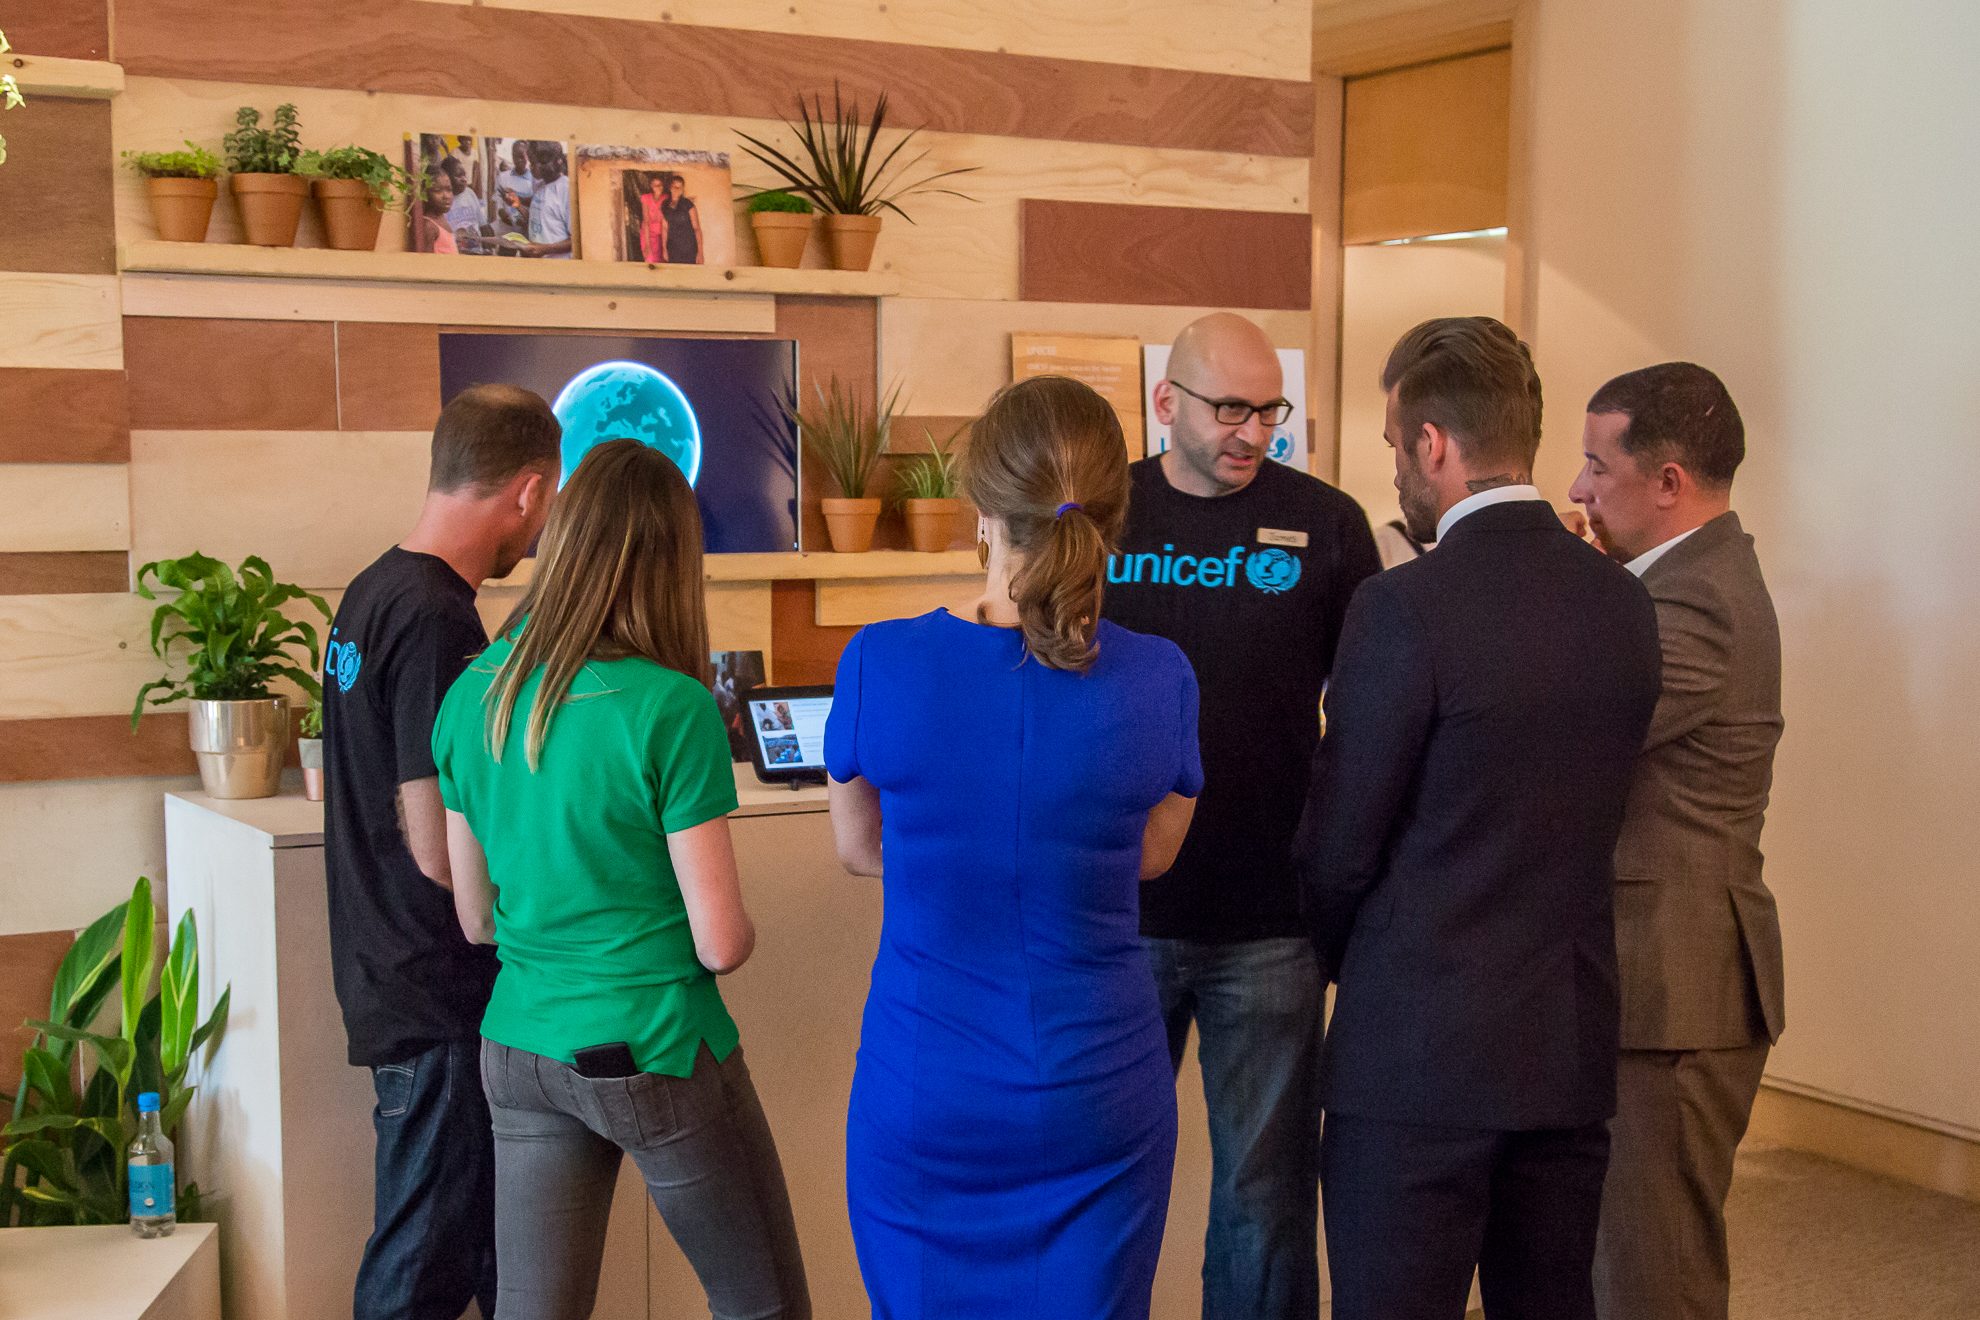
The installation sat near the entrance to the exhibition hall with three UNICEF ambassadors beside it. Delegates walked up, pressed a question, and watched the globe render. The ambassadors talked them through what they were seeing.
It did two things the raw numbers could not. It gave the UNICEF team something physical to talk around rather than a list of statistics, and it put the data on a map, since most guests would not have known where the affected regions were. David Beckham, a UNICEF ambassador, used it himself. When the charts rose out of the globe he said “Wow, that’s cool.”
The build
A team of three: a data engineer, a front-end developer and a project lead. UNICEF’s raw data had been requested, but with a week to go there was no time to wait, so on day one the team scraped it from the public U-Report site, with UNICEF’s permission. The globe was rendered in WebGL, still new at the time and deliberately chosen because the host was Google: a WebGL piece running in Chrome doubled as a showcase for Google’s own technology.
The hard parts were the maths of rotating the globe correctly and mapping real-world coordinates into the renderer’s space so each chart landed on the right region. There was no showcase, no test day and no amends round. The client saw the finished installation for the first time on the morning of the event.
What happened
Every one of the roughly 300 delegates passed through the installations hall, so UNICEF’s team could engage all of them. The client loved it and could not quite believe it had been built in under a week. The project sat in the middle of a long relationship: it was won off the back of the Android work at Mobile World Congress, and it led in turn to more work for Brand Fuel and Google.